

Published by Jon Chambers
Electricity is still fairly mysterious and magical. It runs our entire networked infrastructure and we seldom see it unless we are watching a thunderstorm or an electronic device experiences a catastrophic failure. We plug our devices, computers, phones and WiFi routers into a hole in the wall that supplies us with a seemingly infinite and readily available supply of an invisible force that gives our insatiable need for networked connections and media consumption fuel. As a resident at the International Museum of Surgical Science I mainly researched the early connections that we formed with electricity and its use in medicine. In a book from the museum’s library, Practical Electricity in Medicine and Surgery by Gustav A. Liebig and George Henry Rohé written in 1890, electricity was thought of as a fluid. They observed that the laws of electricity would remain the same, “…whether there are two ‘electric fluids,’ or one electric fluid, or no fluid at all to be considered.” They knew about the laws of electromagnetism but they didn’t know what electricity actually was. Around this same era, diathermy machines were invented that discharge an electric current directly on the body. This exchange between the device and the body’s charge was thought of as healing and beneficial, although these claims were dubious. It was basically just a way to massage and soothe the skin and became less and less in use by the medical field by the 1940s.
Inspired by these early ideas and electronic devices, the work I made for my capstone exhibition draws parallels to our body’s contemporary relationships to electrical and technological interfaces and environments. Today our bodies are still interfacing with electricity, albeit in completely different, abstract and complicated ways and we are still unsure of the benefits. We interface with both software and hardware that use radio waves to communicate and that envelope our bodies. Our bodies are recorded with computer vision systems that analyze our identities. We are constantly performing with our mobile devices by tapping, caressing and moving with them, only to create a heap of data for companies about our behavior. We are constantly massaged by the feedback of this electrical exchange with dopamine rushes from likes, advertisements and play. Our body interfaced with these spaces creates free labor as we train and operate machine learning systems. The internet has expanded beyond a simple interface and has become an environment.1 Our bodies are incorporated in it not just as sources of labor and data points, but are also physically being bombarded by data as “improbable objects, celebrity cat GIFs, and a jumble of unseen anonymous images proliferate and waft through human bodies via Wi-Fi”.2
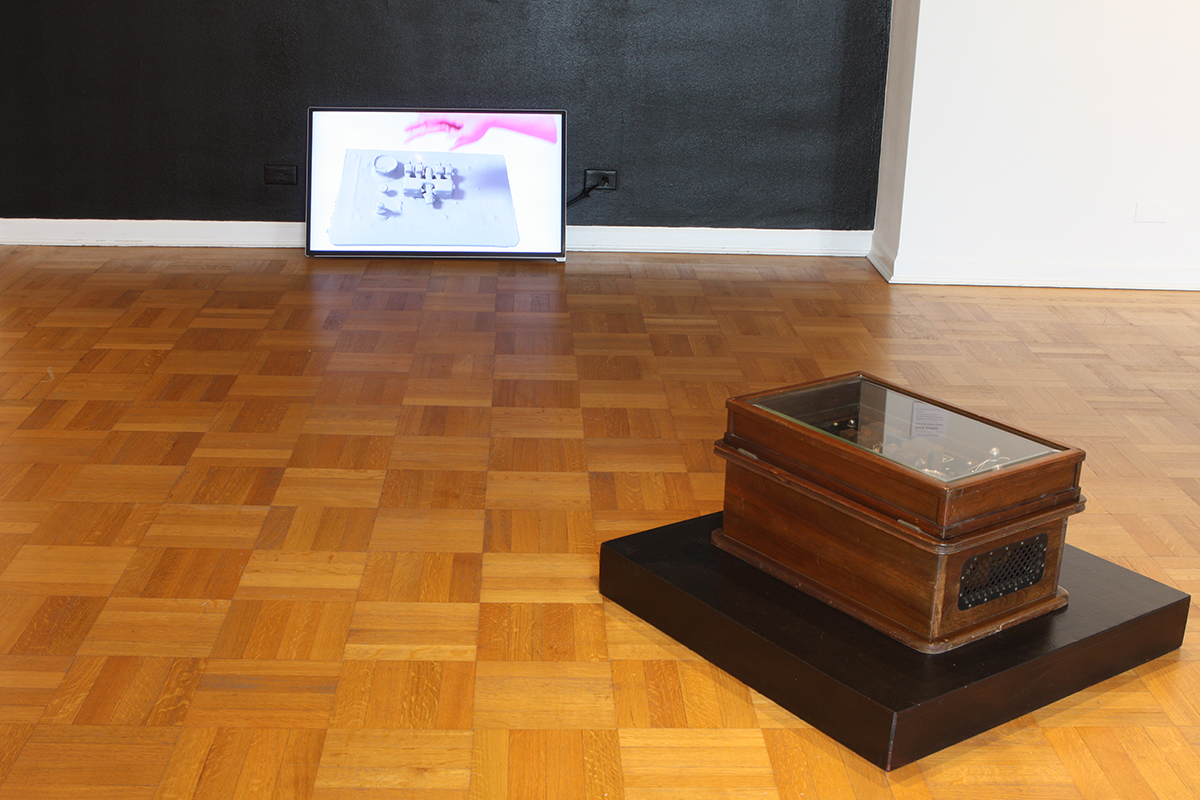
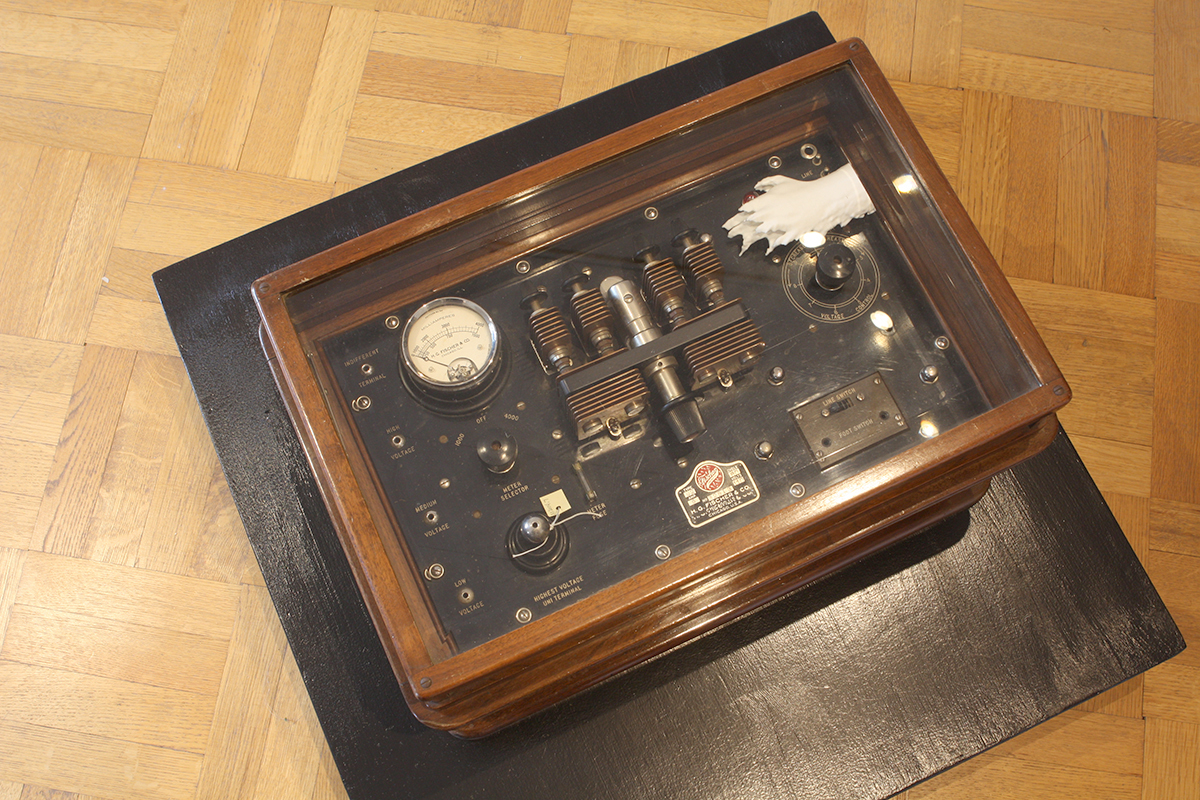
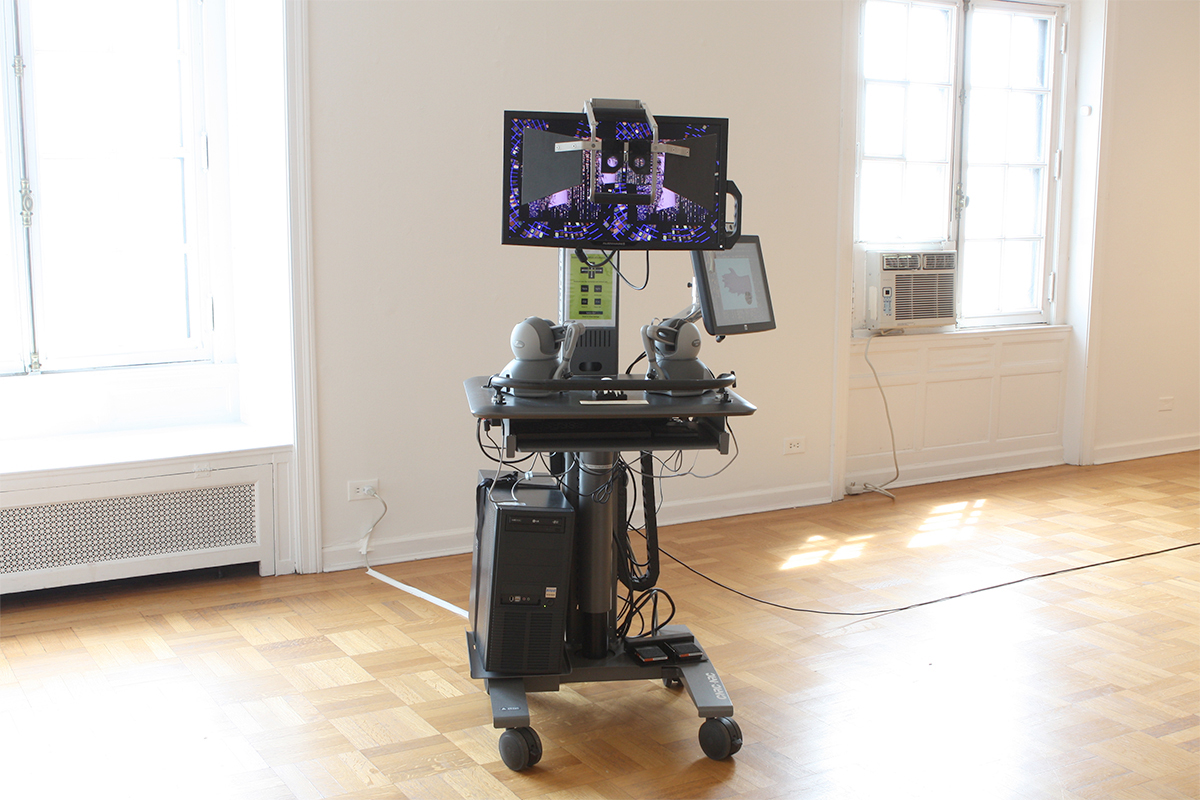
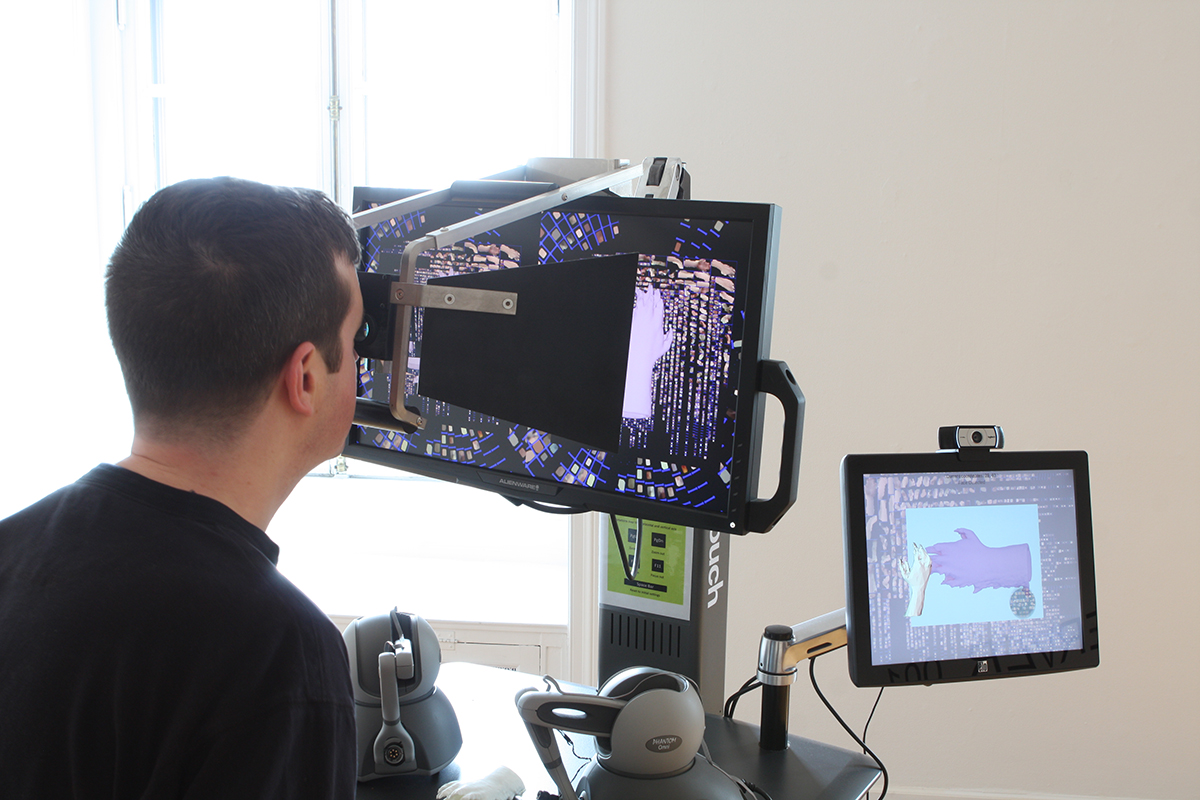
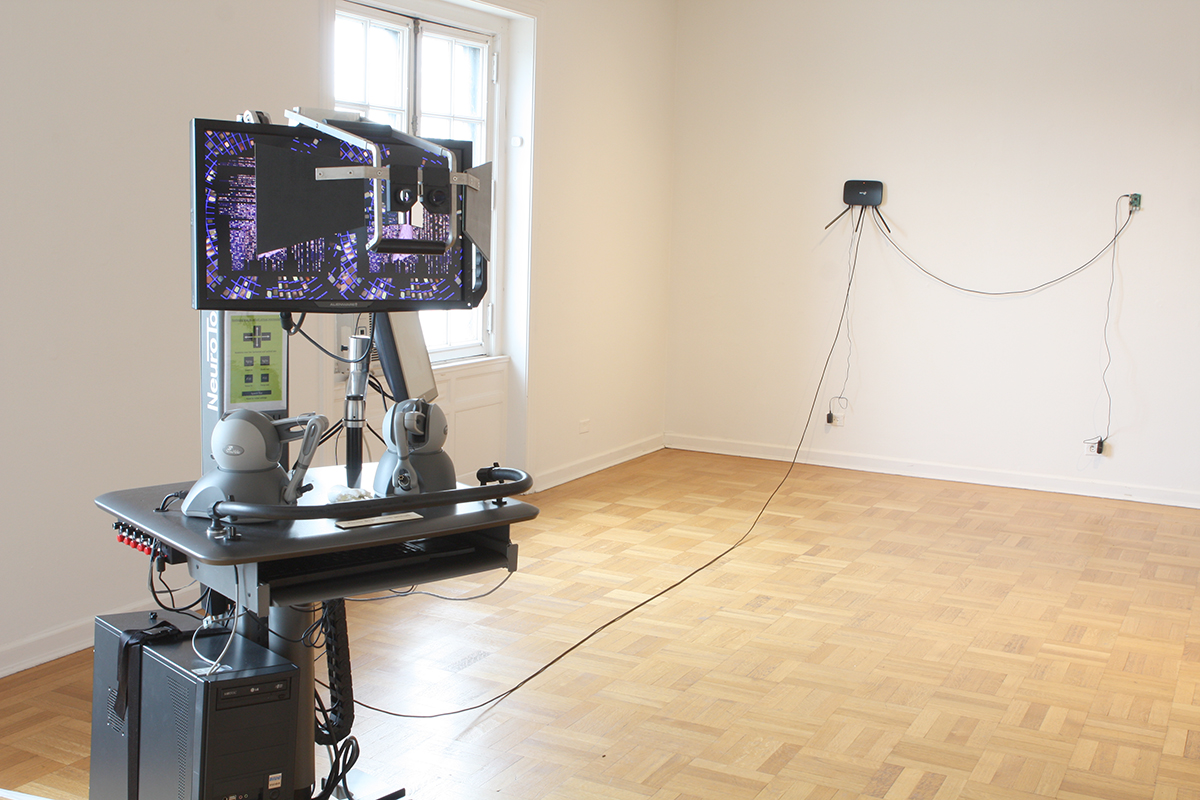
The work in the show considers the hand as the main means of data creation, as it is the central body part used to generate labor and interact with networks, but also to interact with the network set up in the show. Initializing this local feedback network and its relationship to the hand/body, Diathermy Feedback Loop features a 3D scan of a hand interfaced with a diathermy machine while being shocked and paralyzed over and over again. The feedback loop is affecting the body, but it comes back for more. In dialog with the video the actual diathermy machine is displayed with a 3D print of the scanned hand, referencing both the hand and machine’s physical presence. This same hand scan is featured in another animation on another device from the museum’s collection called the NeuroTouch simulator. The NeuroTouch simulator is a neurosurgery trainer that uses a stereoscopic viewer and haptic feedback to perform virtual surgery in a gamified 3D space. I was interested in using this setup for it’s formal presence and, because a computer runs it, for it’s immediate availability to be a part of a network. The animation that’s part of the piece Surface Analysis uses the NeuroTouch’s stereoscopic viewer and features the hand rotating and squirming, as it’s being analyzed and “scanned” into the local network.
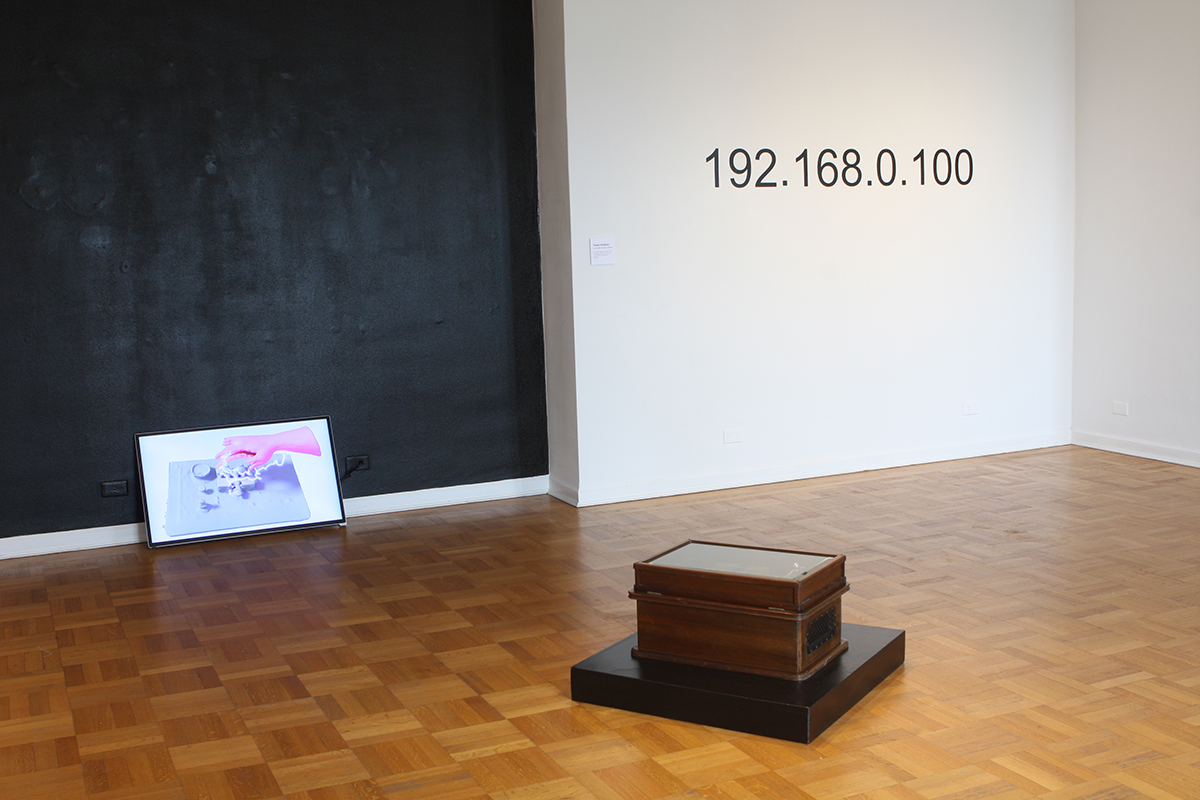
Visitors can also contribute data to the network set up in the show by connecting to a local area network (LAN) with their device and interact with the website Touch Analysis that analyzes simple and mundane touch interactions that they produce. These touch interactions are recorded in a database on the local server that’s part of the piece Server_001: 192.168.0.100. This “metainterface” in the show is explained best by Christian Andersen and Søren Pold in their book The Metainterface:
“[A Metainterface]…points to how surroundings are increasingly turned into data that can be used to determine and anticipate events, and how areas that have not been previously thought of as quantifiable are now regularly quantified and computed…In other words, at the same time as the interface seems to transcend perception, it is omnipresent: it is increasingly difficult to avoid interaction with the networked computers.”3
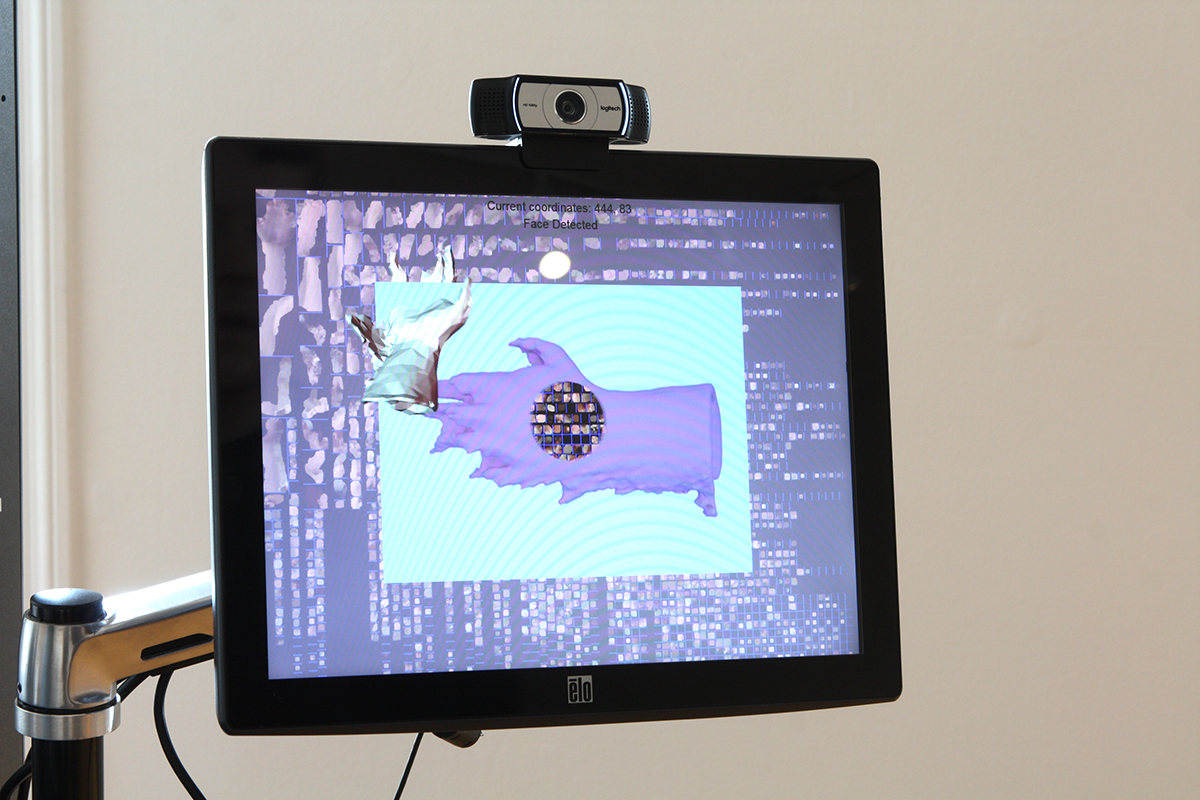
Whereas a seamless corporate “…interface conceals labor and production processes, including its users’ own production of data.”4 The interface and network that I’ve set up in the show reveals the data that is collected from you in a congratulatory and affirmational language after you’ve interacted with the website. You become well aware that this system is collecting data. It’s no big deal. It’s not considered labor at all because it’s provided “voluntarily”.5 But this data collected feeds into the local network just as these types of collection techniques run other larger networked systems. This recorded visitor data is fed into the second screen, and second part of Surface Analysis, on the NeuroTouch station. On this screen, a website is connected to the LAN and displays an animated 3D model of the hand. The movement of the hand across the screen is driven by the algorithm randomly choosing from the cache of saved touches from visitors. The screen displays the touch coordinates that are currently being used to move the hand around. Furthermore, a webcam is scanning for faces, and when it detects one, the visitor can rotate the hand by moving their body (face) back and forth. The visitor’s body is implicated in different ways within the network.
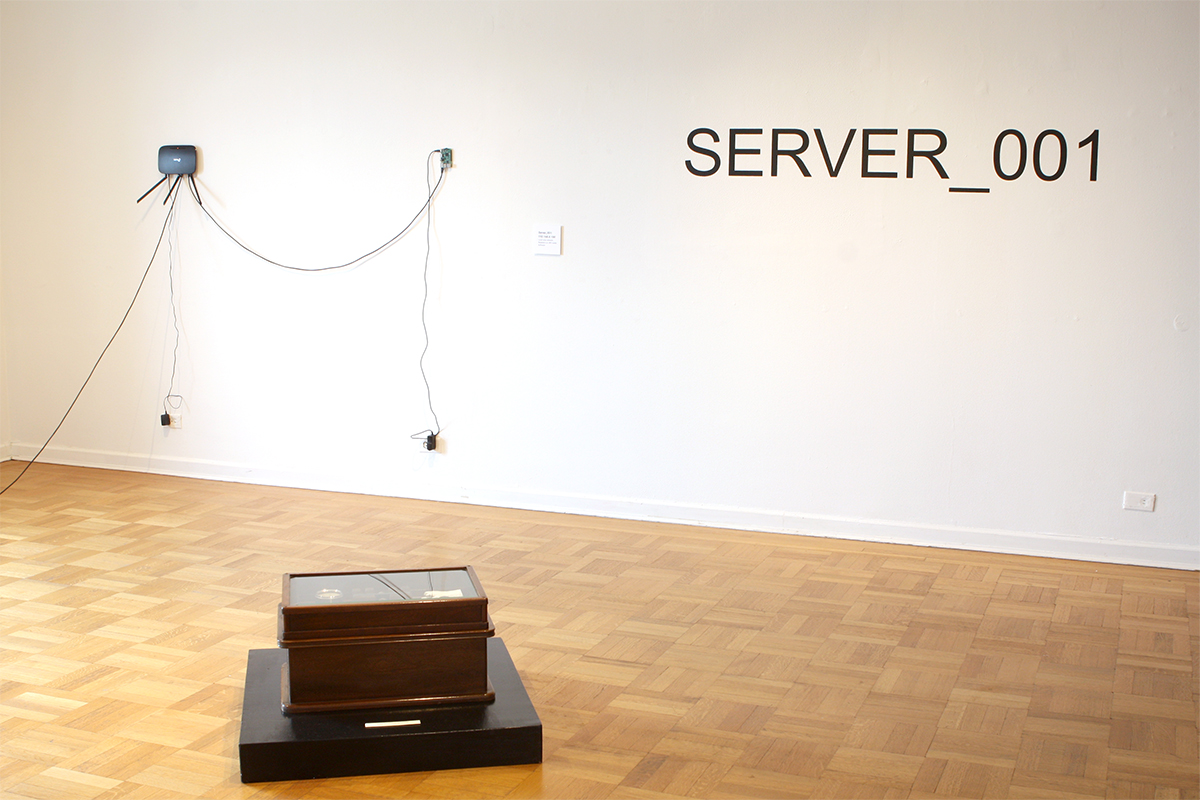
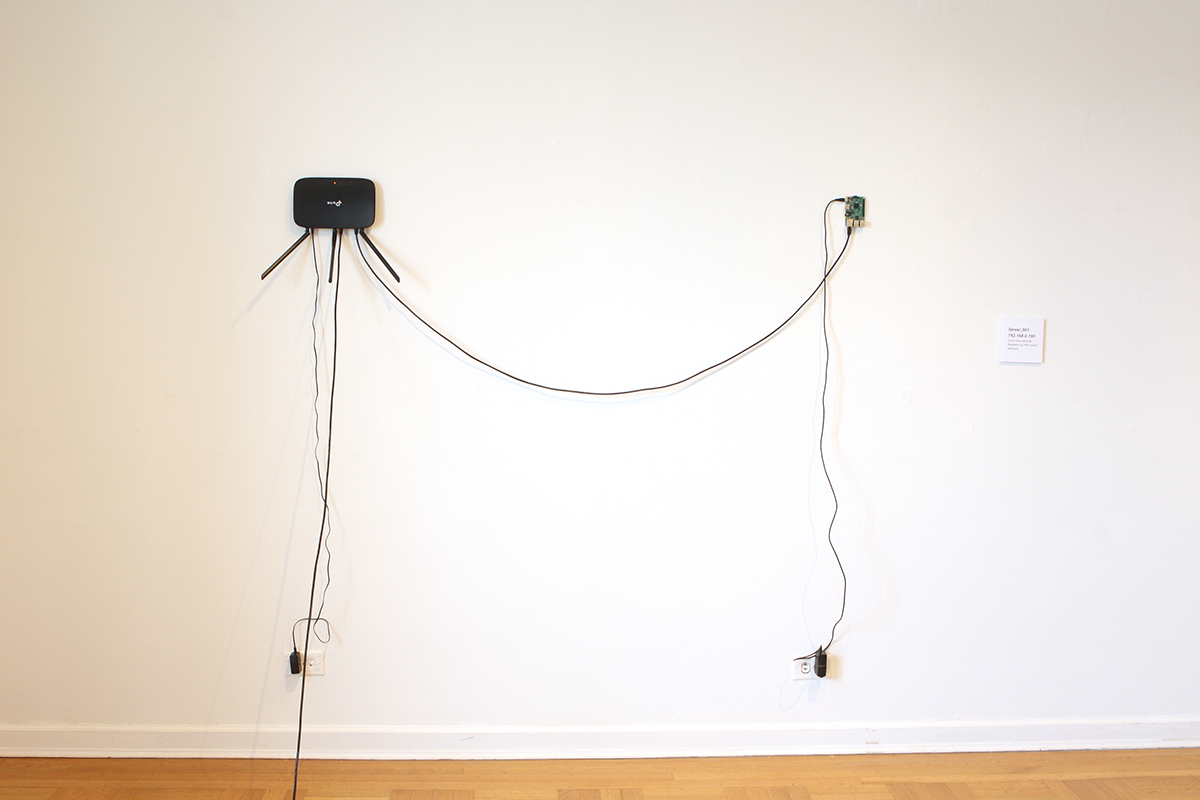
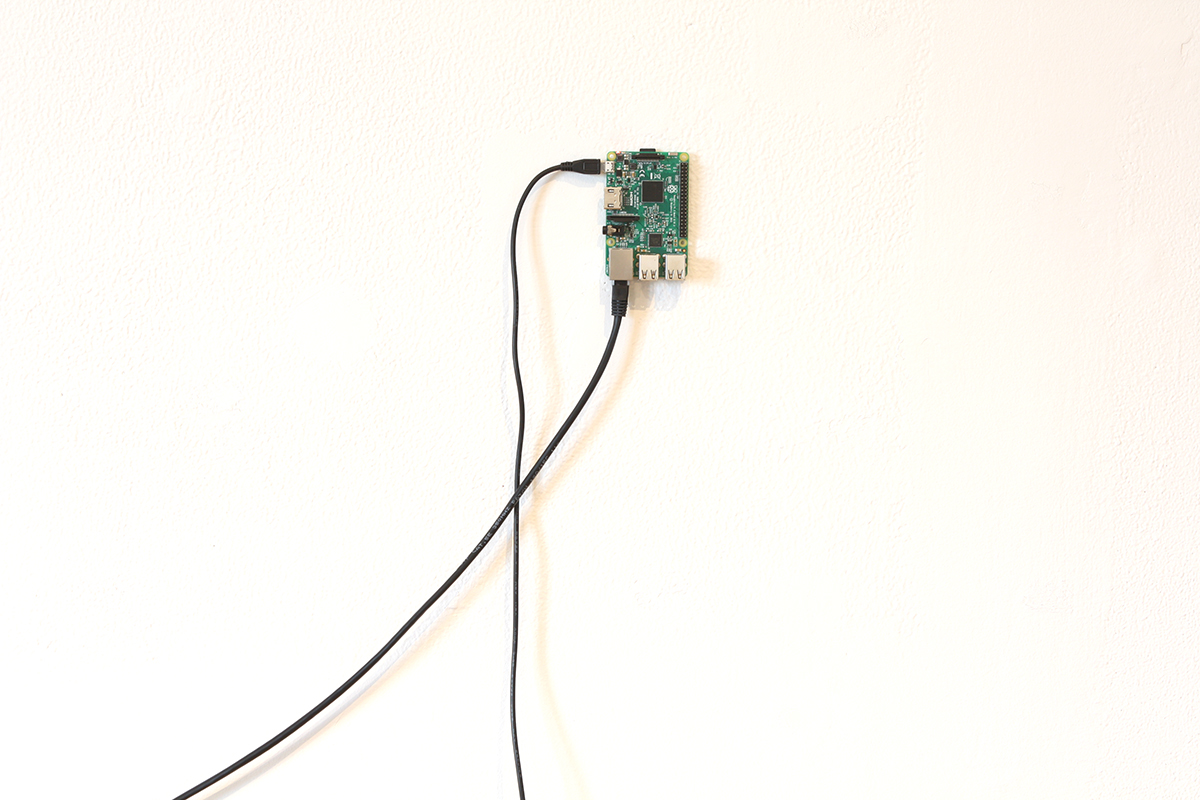
In addition to these data driven feedback loops, I wanted to visualize the network within the show as a physical infrastructure that we are often disconnected from and which is often mythologized. What does the Internet look like? Not a cloud, for sure. In small scale, it looks like the LAN set up in the show for Server_001: 192.168.0.100. This little computer (raspberry pi) is configured as a web server and is hosting the website that you can connect to from your phone via the wifi modem (which is also connected to the web server), and then will send the touch data through the ethernet cable strewn across the floor to the NeuroTouch computer. The metaphor of the cloud is a terrible one and alienates us from actually understanding these infrastructures and pushes us to increasingly think about this space as autonomous from physicality. We interact with the internet wirelessly, but the internet is a physical object ONLY until data travelling through it reaches this last device; your computer, phone, tablet, etc. The internet is strewn across the ocean and wired under and above ground in cities, out of the line of site of humans. Including this piece as a sculptural object was an attempt at grounding what is becoming more and more invisible and cryptic.
This network invisibility creates a disruption. We think that data can exist beyond matter. Perhaps this disconnection from physical infrastructure and these cloud analogies support worn out sci-fi tropes and convince us that our minds can be uploaded and someday exist beyond physicality, so why worry? But if we think we can break with this corporeal world and exist forever in this ether cloud, we are mistaken. As appealing as this is, N. Katherine Hayles reminds us that, “In the face of such a powerful dream, it can be a shock to remember that for information to exist, it must always be instantiated in a medium…”6 Even if we can exist beyond these physical and awkward sacks of water, we can never be disconnected from an energy consuming physical medium. We will still have to live on servers, which will most likely be owned by a data driven conglomerate. We will have to be constantly updated and air conditioned, as data is notoriously fragile and unstable.
Physicality also means that these spaces and objects consume energy; we do not live in a postindustrial society. As networks are contributing to global warming, these “Rising global temperatures will particularly stress data infrastructures that already run hot…”7 and this consumption will be twofold as “Data centres and individual computers generate vast amounts of waste heat, and require corresponding quantities of cooling…”8 These networks consume more and more energy and some, such as cryptocurrency, consume close to as much electricity and energy as some nations.9 The video Server Farm Caress, Emission projected in the black box room playfully points to this energy consumption. The camera starts within a crystalline structure and as it pans out, it’s revealed that it’s a hand that’s attached to a server farm. After a moment, the hand starts to “breath” and the server starts emitting black smoke. The organic hand is massaging the ridged network, producing troves of data while burning through fossil fuels. Eventually the hand stops and the server throws up errors and must restart itself.
As our body becomes a metainterface for these vast systems, we need to consider who trains them (corporations, governments, law enforcement), why (surveillance, commodification), where the data is coming from (racist datasets, trained mainly on white bodies) and how it’s manipulated. You can see these systems working for and against you as you navigate through these networks if you pay attention. The internet is still an amazing place and important projects like Electronic Frontier Foundation, Detroit Community Technology Project and nycmesh offer alternatives, education and solutions to corporatized and surveilled networks. It would be silly to suggest a move away from networked life, as it is an invaluable place to work, connect, create, etc. but media literacy and the ability to understand how manipulation occurs is probably one of the most important topics facing us and needs to be taught at an early age. Computers are stupid and are only as “smart” as you tell them to be, but once these systems are let loose to run on their own there is little agency for humans. As these networks are becoming a bigger part of warming the globe, perhaps we need to reconsider our interactions with them. Will the breaking point be energy credits allotted per month? We started our physical relationship to electricity in order to soothe our bodies with the diathermy machine, now we need to realize just how far this lulling has gone and for what purpose.
References:
1. Steyerl, H. Duty Free Art: Art in the Age of Planetary Civil War. Brooklyn, NY: Verso Books, 2017, 147.
2. Ibid, 150.
3. Andersen, Christian U., and Søren B. Pold. The Metainterface: The Art of Platforms, Cities, and Clouds. Cambridge: MIT Press, 2018, 29-30.
4. Ibid, 27.
5. Steyerl, H. Duty Free Art: Art in the Age of Planetary Civil War. Brooklyn, NY: Verso Books, 2017, 52.
6. Hayles, N. K. How We Became Posthuman: Virtual Bodies in Cybernetics, Literature, and Informatics. Chicago: University of Chicago Press, 1999, 13.
7. Bridle, James. New Dark Age: Technology and the End of the Future. Brooklyn: Verso Books, 2018, 61.
8. Ibid, 61.
9. “Bitcoin’s Insane Energy Consumption, Explained.” Ars Technica. Last modified December 6, 2017. https://arstechnica.com/tech-policy/2017/12/bitcoins-insane-energy-consumption-explained/.
Jon Chambersis an artist and educator based in Chicago where he teaches media literacy, media art histories, net art, new media art (software + hardware) and video at The School of the Art Institute of Chicago, University of Illinois at Chicago and Northwestern University. He has shown work nationally and internationally, in screening venues, galleries and online.

